HOCHTIEF Share
HOCHTIEF went public in the early 1920s. Today the shares are listed in the Prime Standard of Deutsche Börse and can be traded across all German stock exchanges. HOCHTIEF shares are a constituent of the following main stock indices: MDAX, DJ Sustainability World and FTSE4Good.
Key data
| Type of shares | Bearer shares |
| No. of shares | 77,711,300 |
| Share capital | 198,940,928 EUR |
| Market capitalization (Dec 2024) | EUR 9.8bn |
| Average daily trading volume (2024) | 50,007 shares / EUR 5.4m |
| ISIN | DE0006070006 |
| Voting rights | Each share entitles the holder to one vote, no voting right restrictions |
Share Price Chart
Our share price chart is an interactive tool for viewing and analyzing the performance of HOCHTIEF shares.
Analysts
The following is a list of banks and securities dealers who regularly evaluate and give recommendations on the HOCHTIEF share.
| Institution | Location | Analyst |
|---|---|---|
| Bank of America | London | Marcin Wojtal |
| Barclays | London | Tom Zhang |
| Bernstein | Madrid | Victor Acitores |
| BNP Paribas | London | Dario Maglione |
| CaixaBank | Madrid | Filipe Leite |
| HSBC | Düsseldorf | Christoph Dolleschal |
| Jefferies | London | Graham Hunt |
| Kepler Cheuvreux | Madrid | Luis Prieto |
| Landesbank Baden-Württemberg | Stuttgart | Jens Münstermann |
| ODDO BHF | Madrid | Ana Arjona Martínez |
| Stifel Europe | London | Augustin Cendre |
Disclaimer
The research reports and other analysts' statements referred to here have been received from third parties, in particular from equity and credit analysts employed by a range of banks and investment banks. Reference to such reports and statements is provided for information only and does not imply any agreement with or consent to the content of such reports and statements or the information, opinions or conclusions contained therein. HOCHTIEF further draws attention to the disclaimers issued by each firm whose reports and statements are referred to here, which should be read in full. HOCHTIEF accepts no liability for the selection, current relevance, completeness or correctness of the analysts' recommendations or assessments referred to here. None of the information contained or referred to on this Internet site is to be understood as an offer for purchase of shares or bonds of HOCHTIEF or its subsidiaries or related undertakings. Any liability on the part of HOCHTIEF Aktiengesellschaft for losses incurred by third parties arising from the research reports and other analysts' statements contained or referred to on this website is precluded to the extent permitted by law.
Shareholder structure
Based on the voting rights notifications of shareholders according to §§ 33ff. WpHG out latest shareholder structure is as follows (as of November, 2023):
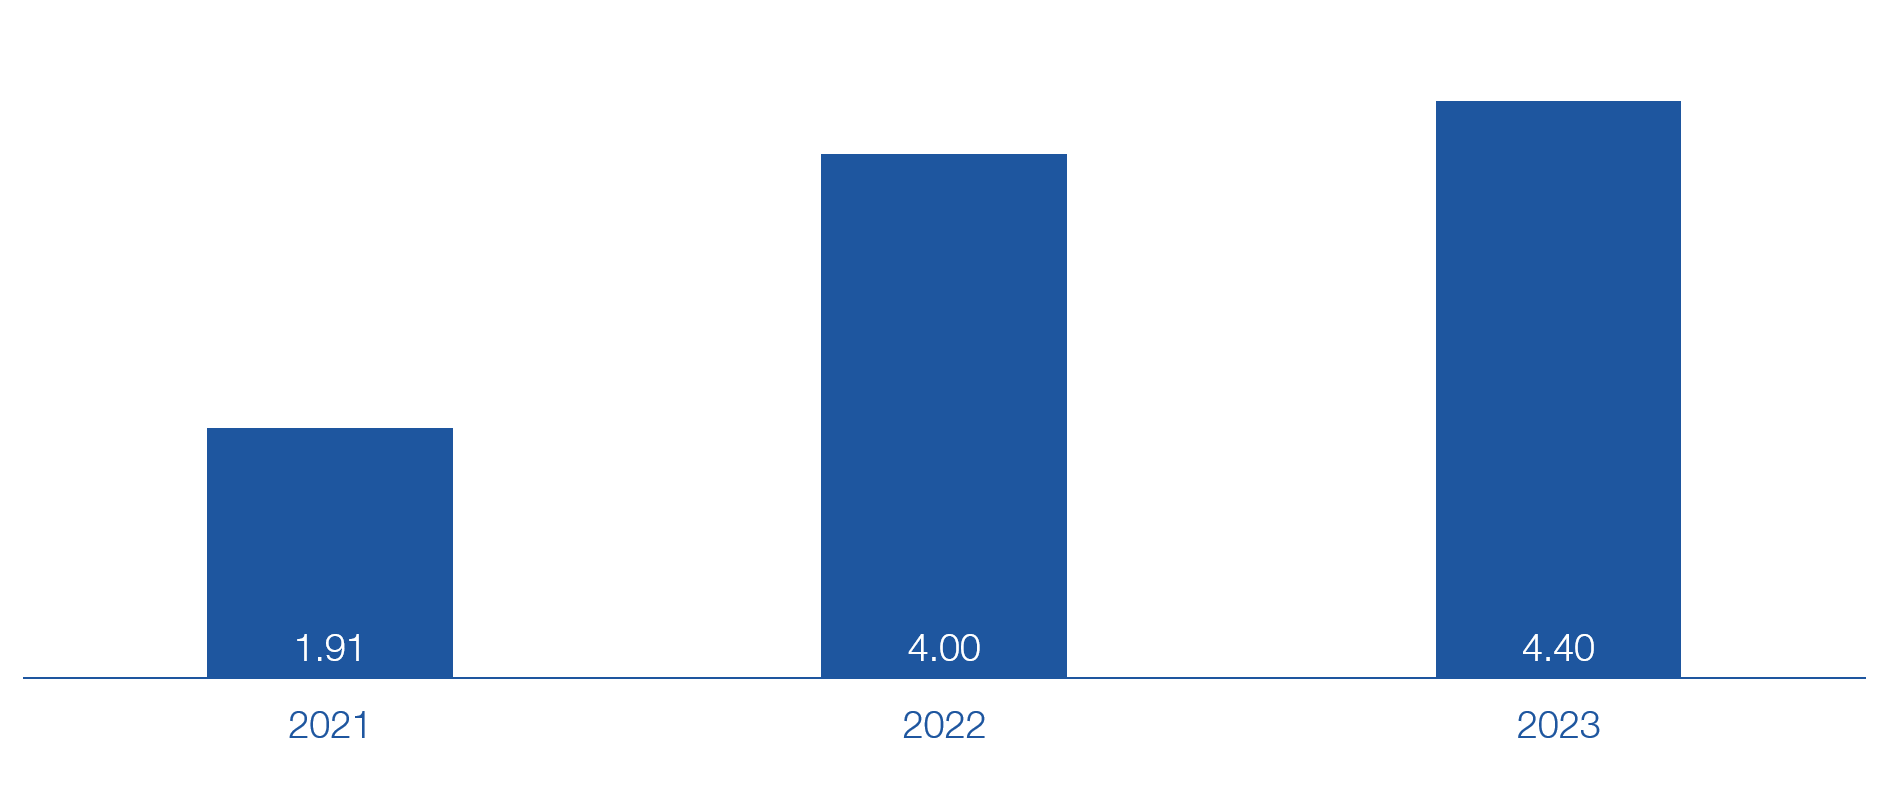
Dividend
Shareholder remuneration continues to be a key element of the Group’s capital allocation strategy.
The proposed dividend for 2024 is EUR 5.23 per share. This represents an outstanding 19% increase year on year compared with EUR 4.40 per share dividend for 2023 and is equivalent to a 65% payout on the operational net profit for the year, in line with prior years.
Furthermore, the group has a track record of additional shareholder remuneration via share buyback programs.
Use of the unappropriated net profit
-
Archive
Use of the unappropriated net profit 2022
Use of the unappropriated net profit 2021
Use of the unappropriated net profit 2020
Use of the unappropriated net profit 2019
Use of the unappropriated net profit 2018
Use of the unappropriated net profit 2017
Use of the unappropriated net profit 2016
Use of the unappropriated net profit 2015
Use of the unappropriated net profit 2014
Use of the unappropriated net profit 2013
Use of the unappropriated net profit 2012
Use of the unappropriated net profit 2011
Use of the unappropriated net profit 2010
Verwendung des Bilanzgewinns 2021
Verwendung des Bilanzgewinns 2020
Verwendung des Bilanzgewinns 2019
Share Buybacks
Share Buyback 2021/2022
The buyback was carried out in the period between November 8, 2021 and November 7, 2022.
Announcement pursuant to Art. 5(1) lit. a) of Regulation (EU) No 596/2014 and Art. 2(1) of Delegated Regulation (EU) 2016/1052, November 8, 2021
Post admission duties announcements
HOCHTIEF Aktiengesellschaft: Disclosure pursuant to Article 5 para. 1 lit. b), para. 3 of Regulation (EU) No. 596/2014, Share buyback—Final report
-
November 2021
-
Week November 8 - November 12, 2021
* Average price rounded (without incidental acquisition fees) ** (Number of stocks * Average price) Date Number of stocks Average price (EUR)* Total stock price (EUR)** Details November 08, 2021 27,560 70.8965 1,953,907.54 PDF November 09, 2021 3,000 71.1087 213,326.10 PDF November 10, 2021 3,000 71.2605 213,781.50 PDF November 11, 2021 3,000 72.4348 217,304.40 PDF November 12, 2021 3,000 71.9421 215,826.30 PDF Total 39,560 71,1361 2,814,145.84 Percent of company's share 0.06
-
Week November 15 - November 19, 2021
* Average price rounded (without incidental acquisition fees) ** (Number of stocks * Average price) Date Number of stocks Average price (EUR)* Total stock price (EUR)** Details November 15, 2021 3,000 72.6827 218,048.18 PDF November 16, 2021 1,000 72.7683 72,768.32 PDF November 17, 2021 1,000 71.7725 71,772.52 PDF November 18, 2021 1,000 70.1919 70,191.88 PDF November 19, 2021 1,000 68.2632 68,263.18 PDF Total 7,000 71.5777 501,044.08 Percent of company's share 0,01
-
Week November 22 - November 26, 2021
* Average price rounded (without incidental acquisition fees) ** (Number of stocks * Average price) Date Number of stocks Average price (EUR)* Total stock price (EUR)** Details November 22, 2021 November 23, 2021 November 24, 2021 November 25, 2021 November 26, 2021 Total Percent of company's share
-
Week November 29 - November 30, 2021
* Average price rounded (without incidental acquisition fees) ** (Number of stocks * Average price) Date Number of stocks Average price (EUR)* Total stock price (EUR)** Details November 29, 2021 November 30, 2021 Total Percent of company's share
* Average price rounded (without incidental acquisition fees) ** (Number of stocks * Average price) Date Number of stocks Average price (EUR)* Total stock price (EUR)** Details Total 46.560 71,2025 3.315.189,84 Percent of company's share capital 0.07
-
Week November 8 - November 12, 2021
-
December 2021
-
Week December 1 - December 3, 2021
* Average price rounded (without incidental acquisition fees) ** (Number of stocks * Average price) Date Number of stocks Average price (EUR)* Total stock price (EUR)** Details December 01, 2021 December 02, 2021 December 03, 2021 Total Percent of company's share
-
Week December 6 - December 10, 2021
* Average price rounded (without incidental acquisition fees) ** (Number of stocks * Average price) Date Number of stocks Average price (EUR)* Total stock price (EUR)** Details December 06, 2021 December 07, 2021 December 08, 2021 December 09, 2021 December 10, 2021 Total Percent of company's share
-
Week December 13 - December 17, 2021
* Average price rounded (without incidental acquisition fees) ** (Number of stocks * Average price) Date Number of stocks Average price (EUR)* Total stock price (EUR)** Details December 13, 2021 December 14, 2021 December 15, 2021 December 16, 2021 December 17, 2021 Total Percent of company's share
-
Week December 20 - December 23, 2021
* Average price rounded (without incidental acquisition fees) ** (Number of stocks * Average price) Date Number of stocks Average price (EUR)* Total stock price (EUR)** Details December 20, 2021 25,000 65.4600 1,636,500.00 PDF December 21, 2021 December 22, 2021 December 23, 2021 Total 25,000 65.4600 1,636,500.00 Percent of company's share 0.04
Date Number of stocks Average price (EUR)* Total stock price (EUR)** Details Total 25,000 65.4600 1,636,500.00 Percent of company's share capital 0.04
-
Week December 1 - December 3, 2021
-
Monthly overview
* Average price rounded (without incidental acquisition fees) ** (Number of stocks * Average price) Month Number of stocks Average price (EUR)* Total stock price (EUR)** Percent of company's share capital November 2021 46,560 71.2025 3,315,189.84 0.07% December 2021 25,000 65,4600 1,636,500.00 0.04% January 2022 February 2022 March 2022 April 2022 May 2022 June 2022 July 2022 August 2022 September 2022 October 2022 November 2022 Total 71,560 69.1963 4,951,689.84 0,10%
Share Buyback 2020
The buyback was carried out in the period between March 10, 2020 and December 31, 2020.
HOCHTIEF Aktiengesellschaft: Announcement pursuant to Art. 5(1) lit. a) of Regulation (EU) No 596/2014 and Art. 2(1) of Delegated Regulation (EU) 2016/1052, March 12, 2020
Post admission duties announcements
HOCHTIEF Aktiengesellschaft: Disclosure pursuant to Article 5 para. 1 lit. b), para. 3 of Regulation (EU) No. 596/2014, Share buyback—Final report
-
March 2020
-
Week March 10 - March 15, 2020
* Average price rounded (without incidental acquisition fees) ** (Number of stocks * Average price) Date Number of stocks Average price (EUR)* Total stock price (EUR)** Details March 10, 2020 March 11, 2020 March 12, 2020 March 13, 2020 Total Percent of company's share capital
-
Week March 16 - March 22, 2020
* Average price rounded (without incidental acquisition fees) ** (Number of stocks * Average price) Date Number of stocks Average price (EUR)* Total stock price (EUR)** Details March 16, 2020 March 17, 2020 March 18, 2020 March 19, 2020 March 20, 2020 Total Percent of company's share capital
-
Week March 23 - March 29, 2020
* Average price rounded (without incidental acquisition fees) ** (Number of stocks * Average price) Date Number of stocks Average price (EUR)* Total stock price (EUR)** Details March 23, 2020 March 24, 2020 66,691 53.76 3,585,501.56 March 25, 2020 48,867 59.23 2,894,587.88 March 26, 2020 20,800 58.43 1,215,256.64 March 27, 2020 71,746 58.13 4,170,530.41 Total 208,104 57.02 11,865,876.49 Percent of company's share capital 0.29
Sharebuyback details of week March 23 - March 29, 2020
March 23, 2020
PDF (12.7 KB)March 24, 2020
PDF (151.0 KB)March 25, 2020
PDF (105.2 KB)March 26, 2020
PDF (53.6 KB)March 27, 2020
PDF (179.8 KB)
-
Week March 30 - March 31, 2020
* Average price rounded (without incidental acquisition fees) ** (Number of stocks * Average price) Date Number of stocks Average price (EUR)* Total stock price (EUR)** Details 30 March, 2020 88,938 56.83 5,053,990.79 31 March, 2020 37,397 58.60 2,191,430.54 Total 126,335 57.35 7,245,421.33 Percent of company's share capital 0.18
* Average price rounded (without incidental acquisition fees) ** (Number of stocks * Average price) Date Number of stocks Average price (EUR)* Total stock price (EUR)** Details Total 208,104 57.02 11,865,876.49 Percent of company's share capital 0.29
-
Week March 10 - March 15, 2020
-
April 2020
-
Week April 01 - April 03, 2020
* Average price rounded (without incidental acquisition fees) ** (Number of stocks * Average price) Date Number of stocks Average price (EUR)* Total stock price (EUR)** Details 01 April, 2020 80,500 58.36 4,697,625.80 02 April, 2020 98,203 59.91 5,883,096.22 03 April, 2020 84,294 60.31 5,083,610.98 Total 262,997 59.56 15,664,333.00 Percent of company's share capital 0.37
-
Week April 06 - April 09, 2020
* Average price rounded (without incidental acquisition fees) ** (Number of stocks * Average price) Date Number of stocks Average price (EUR)* Total stock price (EUR)** Details 06 April, 2020 35,159 63.11 2,219,056.77 07 April, 2020 0 0 0 08 April, 2020 46,204 66.93 3,092,479.92 09 April, 2020 0 0 0 Total 81,363 65.28 5,311,536.69 Percent of company's share capital 0.12
-
Week April 13 - April 17, 2020
-
Week April 20 - April 24, 2020
-
Week April 27 - April 30, 2020
* Average price rounded (without incidental acquisition fees) ** (Number of stocks * Average price) Date Number of stocks Average price (EUR)* Total stock price (EUR)** Details Total 344,360 60.91 20,975,869.70 Percent of company's share capital 0.49
-
Week April 01 - April 03, 2020
-
May 2020
-
Week May 04 - May 08, 2020
* Average price rounded (without incidental acquisition fees) ** (Number of stocks * Average price) Date Number of stocks Average price (EUR)* Total stock price (EUR)** Details May 04, 2020 May 05, 2020 May 06, 2020 May 07, 2020 May 08, 2020
-
Week May 11 - May 15, 2020
* Average price rounded (without incidental acquisition fees) ** (Number of stocks * Average price) Date Number of
stocksAverage
price
(EUR)*Total stock
price (EUR)**Details May 11, 2020 May 12, 2020 May 13, 2020 May 14, 2020 35,166 64.81 2,279,256.16 PDF May 15, 2020 59,121 65.48 3,871,414.53 PDF Total 94,287 65.23 6,150,670.69 Percent of company's share 0.13
-
Week May 18 - May 22, 2020
* Average price rounded (without incidental acquisition fees) ** (Number of stocks * Average price) Date Number of
stocksAverage
price
(EUR)*Total stock
price (EUR)**Details May 18, 2020 35,729 69.35 2,477,698.96 PDF May 19, 2020 35,466 71.54 2,537,138.34 PDF May 20, 2020 36,013 71.54 2,576,334.01 PDF May 21, 2020 35,091 74.61 2,618,199.16 PDF May 22, 2020 35,229 73.67 2,595,475.44 PDF Total 177,528 72.13 12,804,845.91 Percent of company's share 0.25
-
Week May 25 - May 29, 2020
* Average price rounded (without incidental acquisition fees) ** (Number of stocks * Average price) Date Number of
stocksAverage
price
(EUR)*Total stock
price (EUR)**Details May 25, 2020 35,012 76.45 2,676,642.89 PDF May 26, 2020 34,498 80.35 2,771,983.30 PDF May 27, 2020 34,513 83.03 2,865,755.89 PDF May 28, 2020 35,082 82.36 2,889,314.93 PDF May 29, 2020 34,180 79.39 2,713,645.90 PDF Total 173,285 80.31 13,917,342.91 Percent of company's share 0.25
* Average price rounded (without incidental acquisition fees) ** (Number of stocks * Average price) Date Number of stocks Average price (EUR)* Total stock price (EUR)** Details Total 445,100 73.85 32,872,859.51 Percent of company's share 0.63
-
Week May 04 - May 08, 2020
-
June 2020
-
Week 2 June - 5 June, 2020
Date Number of
stocksAverage
price
(EUR)*Total stock
price (EUR)**Details June 02, 20 34,345 84.51 2,902,348.27 PDF June 03, 20 34,911 87.95 3,070,523.69 PDF June 04, 20 35,401 87.72 3,105,372.18 PDF June 05, 20 4,000 88.81 355,225.20 PDF Total 108,657 86.81 9,433,469.34 Percent of company's share 0.15 * Average price rounded (without incidental acquisition fees) ** (Number of stocks * Average price)
-
Week 8 June - 12 June, 2020
Date Number of stocks Average price (EUR)* Total stock price (EUR)** Details June 08, 20 1,079 88.05 95,005.95 PDF June 09, 20 36,632 84.46 3,094,132.87 PDF June 10 20 37,961 82.03 3,113,978.79 PDF June 11, 20 37,970 77.60 2,946,422.64 PDF June 12, 20 1,244 74.45 92,615.92 PDF Total 114,886 81.32 9,342,156.17 Percent of company's share 0.16 * Average price rounded (without incidental acquisition fees) ** (Number of stocks * Average price)
-
Week 15 June - 19 June, 2020
Date Number of stocks Average price (EUR)* Total stock price (EUR)** Details June 15, 20 1,000 73.60 73,600.00 PDF June 16, 20 2,100 78.89 165,665.01 PDF June 17, 20 38,113 79.56 3,032,121.64 PDF June 18, 20 17,508 78.13 1,367,830.01 PDF June 19, 20 7,712 78.82 607,865.24 PDF Total 66,433 78.98 5,247,081.90 Percent of company's share 0.09 * Average price rounded (without incidental acquisition fees) ** (Number of stocks * Average price)
-
Week 22 June - 26 June, 2020
Date Number of stocks Average price (EUR)* Total stock price (EUR)** Details June 22, 20 21,700 77.07 1,672,314.84 PDF June 23, 20 7,725 77.84 601,317.86 PDF June 24, 20 39,322 77.04 3,029,492.71 PDF June 25, 20 4,168 74.82 311,858.10 PDF June 26, 20 19,967 77.18 1,541,112.96 PDF Total 92,882 77.05 7,156,096.47 Percent of company's share 0.13 * Average price rounded (without incidental acquisition fees) ** (Number of stocks * Average price)
- Week 29 June - 30 June, 2020
Date Number of stocks Average price (EUR)* Total stock price (EUR)** Details Total 388,708 81.38 31,631,361.54 Percent of company's share 0.55
-
Week 2 June - 5 June, 2020
-
August 2020
-
Week 3 August - 7 August, 2020
Date Number of stocks Average price (EUR)* Total stock price (EUR)** Details August 3, 20 August 4, 20 15,274 70.91 1,083,120.58 PDF August 5, 20 500 72.50 36,250.00 PDF August 6, 20 33,666 72.93 2,455,177.22 PDF August 7, 20 33,938 73.63 2,498,800.64 PDF Total 83,378 72.84 6,073,348.43 Percent of company's share 0.12 * Average price rounded (without incidental acquisition fees) ** (Number of stocks * Average price)
-
Week 10 August - 14 August, 2020
Date Number of stocks Average price (EUR)* Total stock price (EUR)** Details August 10, 20 2,500 75.56 188,900.00 PDF August 11, 20 11,655 79.31 924,366.21 PDF August 12, 20 18,228 79.42 1,447,700.57 PDF August 13, 20 36,989 77.56 2,868,926.02 PDF August 14, 20 37,475 75.60 2,833,087.52 PDF Total 106,847 77.33 8,262,980.32 Percent of company's share 0.15 * Average price rounded (without incidental acquisition fees) ** (Number of stocks * Average price)
-
Week 17 August - 21 August, 2020
Date Number of stocks Average price (EUR)* Total stock price (EUR)** Details August 17, 20 23,027 76.64 1,764,872.18 PDF August 18, 20 13,434 76.51 1,027,840.71 PDF August 19, 20 4,121 76.47 315,146.88 PDF August 20, 20 18,376 76.66 1,408,650.87 PDF August 21, 20 18,065 76.56 1,382,987.75 PDF Total 77,023 76.59 5,899,498.39 Percent of company's share 0.11 * Average price rounded (without incidental acquisition fees) ** (Number of stocks * Average price)
Date Number of stocks Average price (EUR)* Total stock price (EUR)** Details Total 267,248 75.72 20,235,827.15 Percent of company's share 0.38
-
Week 3 August - 7 August, 2020
-
September 2020
-
Week 1 September - 4 September, 2020
-
Week 7 September - 11 September, 2020
-
Week 14 September - 18 September, 2020
-
Week 21 September - 25 September, 2020
Date Number of stocks Average price (EUR)* Total stock price (EUR)** Details September 21, 20 28,869 65.52 1,891,479.56 PDF September 22, 20 31,916 64.41 2,055,648.92 PDF September 23, 20 34,248 67.61 2,315,551.80 PDF September 24, 20 35,956 64.77 2,329,031.92 PDF September 25, 20 37,450 64.98 2,433,422.36 PDF Total 168,439 65.45 11,025,134.56 Percent of company's share 0.24 * Average price rounded (without incidental acquisition fees) ** (Number of stocks * Average price)
-
Week 28 September - 30 September, 2020
Date Number of stocks Average price (EUR)* Total stock price (EUR)** Details September 28, 20 6,000 67.63 405,750.00 PDF September 29, 20 September 30, 20 Total 6,000 67.63 405,750.00 Percent of company's share 0.01 * Average price rounded (without incidental acquisition fees) ** (Number of stocks * Average price)
Date Number of stocks Average price (EUR)* Total stock price (EUR)** Details Total 174,439 65.53 11,430,884.56 Percent of company's share 0.25
-
Week 1 September - 4 September, 2020
-
October 2020
-
Week 1 October - 2 October, 2020
-
Week 5 October - 9 October, 2020
-
Week 12 October - 16 October, 2020
-
Week 19 October - 23 October, 2020
Date Number of stocks Average price (EUR)* Total stock price (EUR)** Details October 19, 20 October 20, 20 45,016 69.04 3,107,922.65 PDF October 21, 20 44,135 67.34 2,971,856.71 PDF October 22, 20 43,775 67.32 2,946,749.15 PDF October 23, 20 2,000 68.55 137,100.00 PDF Total 134,926 67.91 9,163,628.50 Percent of company's share 0.19 * Average price rounded (without incidental acquisition fees) ** (Number of stocks * Average price)
-
Week 26 October - 30 October, 2020
Date Number of stocks Average price (EUR)* Total stock price (EUR)** Details October 26, 20 44,958 68.38 3,074,434.85 PDF October 27, 20 45,007 66.49 2,992,308.40 PDF October 28, 20 45,387 63.68 2,890,339.47 PDF October 29, 20 46,609 63.29 2,949,785.73 PDF October 30, 20 47.749 64,82 2.982.159,02 PDF Total 229,710 64,82 14,889,027.47 Percent of company's share 0.32 * Average price rounded (without incidental acquisition fees) ** (Number of stocks * Average price)
Date Number of stocks Average price (EUR)* Total stock price (EUR)** Details Total 364,636 65.96 24,052,655.97 Percent of company's share 0.52
-
Week 1 October - 2 October, 2020
-
November 2020
-
Week 2 November - 6 November, 2020
Date Number of stocks Average price (EUR)* Total stock price (EUR)** Details November 2, 20 43,705 65.52 2,863,381.15 PDF November 3, 20 1,000 67.05 67,050.00 PDF November 4, 20 24,575 65.83 1,617,669.04 PDF November 5, 20 5,343 65.89 352,031.57 PDF November 6, 20 43,364 65.55 2,842,566.57 PDF Total 117,987 65.62 7,742,698.33 Percent of company's share 0,17 * Average price rounded (without incidental acquisition fees) ** (Number of stocks * Average price)
-
Week 9 November - 13 November, 2020
-
Week 16 November - 20 November, 2020
-
Week 23 November - 27 November, 2020
-
Week 30 November, 2020
Date Number of stocks Average price (EUR)* Total stock price (EUR)** Details Total 117,987 65.62 7.742.698,33 Percent of company's share 0,17
-
Week 2 November - 6 November, 2020
-
Monthly overview
* Average price rounded (without incidental acquisition fees) ** (Number of stocks * Average price) Month Number of stocks Average price (EUR)* Total stock price (EUR)** Percent of company's share capital March 2020 334,439 57.14 19,111,297.82 0.47 April 2020 344,360 60.91 20,975,869.70 0.49 May 2020 445,100 73.85 32,872,859.51 0.63 June 2020 388,708 81,38 31,631,361.54 0.55 August 2020 267,248 75.72 20,235,827.15 0.38 September 2020 174,439 65.53 11,430,884.56 0.25 October 2020 364,636 65.96 24,052,655.97 0.19 November 2020 117,987 65.62 7,742,698.33 0.17 Total 2,436,917 68.96 168,053,454.56 3.45
Share BuyBack 2016
The buyback was carried out in the period between January 12, 2016 and March 10, 2016.
-
January 2016
-
Week January 12 - January 15, 2016
* Average price rounded (without incidental acquisition fees), ** (Number of stocks * Average price) Date Number of stocks Average price (EUR)* Total stock price (EUR)** Details January 12, 2016 28,539 82.9739 2,367,992.13 January 13, 2016 28,226 84.0646 2,372,807.40 January 14, 2016 29,885 81.3424 2,430,917.62 January 15, 2016 24,750 80.7121 1,997,624.48 Total 111,400 82.3101 9,169,341.63
-
Week January 18 - January 22, 2016
* Average price rounded (without incidental acquisition fees) ** (Number of stocks * Average price) Date Number of stocks Average price (EUR)* Total stock price (EUR)** Details January 18, 2016 28.031 80,0582 2.244.111,40 January 19, 2016 27.048 82,6256 2.234.857,23 January 20, 2016 27.464 81,2617 2.231.771,33 January 21, 2016 28.214 81,8167 2.308.376,37 January 22, 2016 27.367 84,1192 2.302.090,15 Total 138.124 81,9641 11.321.206,48
-
Week January 25 - January 29, 2016
* Average price rounded (without incidental acquisition fees) ** (Number of stocks * Average price) Date Number of stocks Average price (EUR)* Total stock price (EUR)** Details January 25, 2016 27.806 83,3291 2.317.048,95 January 26, 2016 13.913 82,7004 1.150.610,67 January 27, 2016 24.669 83,3505 2.056.173,48 January 28, 2016 29.152 83,8611 2.444.718,79 January 29, 2016 25.341 83,7569 2.122.483,60 Total 120.881 83,4791 10.091.035,49 * Average price rounded (without incidental acquisition fees) ** (Number of stocks * Average price) Date Number of stocks Average price (EUR)* Total stock price (EUR)** Details Total 370,405 82.5626 30,581,583.60 Percent of company's share capital 0.53
* Average price rounded (without incidental acquisition fees), ** (Number of stocks * Average price) Date Number of stocks Average price (EUR)* Total stock price (EUR)** Details Total 370,405 82.5626 30,581,583.60 Percent of company's share capital 0.53
-
Week January 12 - January 15, 2016
-
February 2016
-
Week February 01 - February 05, 2016
* Average price rounded (without incidental acquisition fees) ** (Number of stocks * Average price) Date Number of stocks Average price (EUR)* Total stock price (EUR)** Details February 01, 2016 26,108 85.1184 2,222,271.19 February 02, 2016 30,640 84.3723 2,585,167.27 February 03, 2016 30,859 83.9066 2,589,273.77 February 04, 2016 31,671 83.8404 2,655,309.31 February 05, 2016 32,335 83.2178 2,690,847.56 Total 151,613 84.0487 12,742,869.10
-
Week February 08 - February 12, 2016
* Average price rounded (without incidental acquisition fees) ** (Number of stocks * Average price) Date Number of stocks Average price (EUR)* Total stock price (EUR)** Details February 08, 2016 33,023 79.3979 2,621,956.85 February 09, 2016 30,491 77.4995 2,363,037.25 February 10, 2016 35,362 80.5202 2,847,355.31 February 11, 2016 36,501 79.4600 2,900,369.46 February 12, 2016 32,207 79.7177 2,567,467.96 Total 167,584 79.3643 13,300,186.83
-
Week February 15 - February 19, 2016
* Average price rounded (without incidental acquisition fees) ** (Number of stocks * Average price) Date Number of stocks Average price (EUR)* Total stock price (EUR)** Details February 15, 2016 16,500 84.1234 1,388,036.10 February 16, 2016 30,750 83.7332 2,574,795.90 February 17, 2016 23,472 85.7747 2,013,303.76 February 18, 2016 35,896 86.7538 3,114,114.40 February 19, 2016 35,115 85.7630 3,011,567.75 Total 141,733 85.3846 12,101,817.91
-
Week February 22 - February 26, 2016
* Average price rounded (without incidental acquisition fees) ** (Number of stocks * Average price) Date Number of stocks Average price (EUR)* Total stock price (EUR)** Details February 22, 2016 38,094 87.2140 3,322,330.12 February 23, 2016 38,901 88.2616 3,433,464.50 February 24, 2016 33,702 86.7675 2,924,238.29 February 25, 2016 2,600 90.5485 235.426,10 February 26, 2016 0,000 00.0000 000,000.00 Total 113,297 87.5174 9,915,459.01
-
Week February 29 2016
* Average price rounded (without incidental acquisition fees) ** (Number of stocks * Average price) Date Number of stocks Average price (EUR)* Total stock price (EUR)** Details February 29, 2016 0,000 00.0000 000,000.00 Total 0,000 00.0000 000,000.00
* Average price rounded (without incidental acquisition fees) ** (Number of stocks * Average price) Date Number of stocks Average price (EUR)* Total stock price (EUR)** Details Total previous months 370,405 82.5626 30,581,583.60 Total 944,632 83.2514 78,641,916.45 Percent of company's share capital 1.36
* Average price rounded (without incidental acquisition fees) , ** (Number of stocks * Average price) Date Number of stocks Average price (EUR)* Total stock price (EUR)** Details Total previous months 370,405 82.5626 30,581,583.60 Total 944,632 83.2514 78,641,916.45 Percent of company's share capital 1.36
-
Week February 01 - February 05, 2016
-
March 2016
-
Week March 01 - March 04, 2016
* Average price rounded (without incidental acquisition fees) ** (Number of stocks * Average price) Date Number of stocks Average price (EUR)* Total stock price (EUR)** Details March 01, 2016 0,000 00.0000 000,000.00 March 02, 2016 10.085 100.5492 1,014,038.68 On March 2, 2016, the share buyback program has been suspended until further notice. March 03, 2016 March 04, 2016 Total 10.085 100.5492 1,014,038.68
-
Week March 07 - March 11, 2016
* Average price rounded (without incidental acquisition fees) ** (Number of stocks * Average price) Date Number of stocks Average price (EUR)* Total stock price (EUR)** Details March 07, 2016 March 08, 2016 March 09, 2016 March 10, 2016 HOCHTIEF decides to cancel share buyback. Total
* Average price rounded (without incidental acquisition fees) ** (Number of stocks * Average price) Date Number of stocks Average price (EUR)* Total stock price (EUR)** Details Total previous months 944,632 83.2514 78,641,916.45 Total 954,717 83.4341 79,655,955.13 Percent of company's share capital 1.38
* Average price rounded (without incidental acquisition fees) ,** (Number of stocks * Average price) Date Number of stocks Average price (EUR)* Total stock price (EUR)** Details Total previous months 944,632 83.2514 78,641,916.45 Total 954,717 83.4341 79,655,955.13 Percent of company's share capital 1.38
-
Week March 01 - March 04, 2016
-
Monthly overview
* Average price rounded (without incidental acquisition fees) ,** (Number of stocks * Average price) Month Number of stocks Average price (EUR)* Total stock price (EUR)** Percent of company's share capital January 2016 370,405 82.5626 30,581,583.60 0.53 February 2016 574,227 83.6957 48,060,332.85 0.83 March 2016 10.085 100.5492 1,014,038.68 0.02 Total 954,717 83.4341 79,655,955.13 1.38
Share BuyBack 2014/2015
The buyback was carried out in the period between October 7, 2014 and December 31, 2015.
-
October 2014
-
Week October 07 - October 10, 2014
* Average price rounded (without incidental acquisition fees) ** (Number of stocks * Average price) Date Number of stocks Average price (EUR)* Total stock price (EUR)** Details October 07, 2014 32,472 58.2716 1,892,195.40 October 08, 2014 34,047 56.6783 1,929,726.08 October 09, 2014 36,017 56.8631 2,048,038.27 October 10, 2014 38,504 55.1475 2,123,399.34 Total 141,040 56.6744 7,993,359.09
-
Week October 13 - October 17, 2014
* Average price rounded (without incidental acquisition fees) ** (Number of stocks * Average price) Date Number of stocks Average price (EUR)* Total stock price (EUR)** Details October 13, 2014 32,000 55.4519 1,774,460.80 October 14, 2014 30,000 55.8614 1,675,842.00 October 15, 2014 42,337 55.3244 2,342,269.12 October 16, 2014 37,153 53.8554 2,000,889.68 October 17, 2014 27,992 56.4889 1,581,237.29 Total 169,482 55.3138 9,374,698.89
-
Week October 20 - October 24, 2014
* Average price rounded (without incidental acquisition fees) ** (Number of stocks * Average price) Date Number of stocks Average price (EUR)* Total stock price (EUR)** Details October 20, 2014 31,777 56.4246 1,793,004.51 October 21, 2014 12,655 57.0415 721,860.18 October 22, 2014 30,156 57.5677 1,736,011.56 October 23, 2014 19,500 58.0805 1,132,569.75 October 24, 2014 41,500 58.4992 2,427,716.80 Total 135,588 57.6095 7,811,162.80
-
Week October 27 - October 31, 2014
* Average price rounded (without incidental acquisition fees) ** (Number of stocks * Average price) Date Number of stocks Average price (EUR)* Total stock price (EUR)** Details Total 573,685 56.6819 32,517,560.14 Percent of company's share capital 0.83
* Average price rounded (without incidental acquisition fees) ** (Number of stocks * Average price) Date Number of stocks Average price (EUR)* Total stock price (EUR)** Details Total 573,685 56.6819 32,517,560.14 Percent of company's share capital 0.83
-
Week October 07 - October 10, 2014
-
November 2014
-
Week November 03 - November 07, 2014
* Average price rounded (without incidental acquisition fees) ** (Number of stocks * Average price) Date Number of stocks Average price (EUR)* Total stock price (EUR)** Details November 03, 2014 21,540 60.0711 1,293,931.49 November 04, 2014 24,300 59.3119 1,441,279.17 November 05, 2014 21,000 58.7524 1,233,800.40 November 06, 2014 28,718 59.1126 1,697,595.65 November 07, 2014 22,750 57.1403 1,299,941.83 Total 118,308 58.8848 6,966,548.54
-
Week November 10 - November 14, 2014
* Average price rounded (without incidental acquisition fees) ** (Number of stocks * Average price) Date Number of stocks Average price (EUR)* Total stock price (EUR)** Details November 10, 2014 1,900 57.7405 109,706.95 November 11, 2014 20,200 59.2384 1,196,615.68 November 12, 2014 20,100 58.1364 1,168,541.64 November 13, 2014 34,688 57.9284 2,009,420.34 November 14, 2014 10,576 57.3829 606,881.55 Total 87,464 58.2087 5,091,166.16
-
Week November 17 - November 21, 2014
* Average price rounded (without incidental acquisition fees) ** (Number of stocks * Average price) Date Number of stocks Average price (EUR)* Total stock price (EUR)** Details November 17, 2014 7,200 58.6881 422,554.32 November 18, 2014 7,600 59.9660 455,741.60 November 19, 2014 5,700 59.8899 341,372.43 November 20, 2014 6,100 59.7374 364,398.14 November 21, 2014 0 0.0000 0.00 Total 26,600 59.5514 1,584,066.49
-
Week November 24 - November 28, 2014
* Average price rounded (without incidental acquisition fees) ** (Number of stocks * Average price) Date Number of stocks Average price (EUR)* Total stock price (EUR)** Details November 24, 2014 0 0.0000 0.00 November 25, 2014 6,800 59.4074 403,970.32 November 26, 2014 439 59.7646 26,236.66 November 27, 2014 0 0.0000 0.00 November 28, 2014 0 0.0000 0.00 Total 7,239 59.4291 430,206.98
* Average price rounded (without incidental acquisition fees) ** (Number of stocks * Average price) Date Number of stocks Average price (EUR)* Total stock price (EUR)** Details Total previous month 573,685 56.6819 32,517,560.14 Total 813,296 57.2849 46,589,548.31 Percent of company's share capital 1.17
-
Week November 03 - November 07, 2014
-
December 2014
-
Week December 01 - December 05, 2014
* Average price rounded (without incidental acquisition fees) ** (Number of stocks * Average price) Date Number of stocks Average price (EUR)* Total stock price (EUR)** Details December 01, 2014 0 0.0000 0,00 December 02, 2014 1,700 58.5674 99,564.58 December 03, 2014 1,300 57.9631 75,352.03 December 04, 2014 2,600 58.3190 151,629.40 December 05, 2014 1,000 58.1970 58,197.00 Total 6,600 58.2944 384,743.01
-
Week December 08 - December 12, 2014
* Average price rounded (without incidental acquisition fees) ** (Number of stocks * Average price) Date Number of stocks Average price (EUR)* Total stock price (EUR)** Details December 08, 2014 1,350 58.8800 79.488.00 December 09, 2014 1,300 57.1769 74,329.97 December 10, 2014 2,500 57.2224 143,056.00 December 11, 2014 400 57.1975 22,879.00 December 12, 2014 1,800 57.1567 102,882.06 Gesamtsumme 7,350 57.5014 422,635.03
-
Week December 15 - December 19, 2014
* Average price rounded (without incidental acquisition fees) ** (Number of stocks * Average price) Date Number of stocks Average price (EUR)* Total stock price (EUR)** Details December 15, 2014 5,000 55.5448 277,724.00 December 16, 2014 1,300 54.7031 71,114.03 December 17, 2014 1,100 55.2827 60,810.97 December 18, 2014 500 57.2360 28,618.00 December 19, 2014 2,000 57.3810 114,762.00 Total 9,900 55.8615 553,029.00
-
Week December 22 - December 26, 2014
* Average price rounded (without incidental acquisition fees) ** (Number of stocks * Average price) Date Number of stocks Average price (EUR)* Total stock price (EUR)** Details December 22, 2014 1,643 58.0779 95,421.99 December 23, 2014 200 58.5000 11,700.00 Total 1,843 58.1237 107,121.99
-
Week December 29 -January 02, 2015
* Average price rounded (without incidental acquisition fees) ** (Number of stocks * Average price) Date Number of stocks Average price (EUR)* Total stock price (EUR)** Details December 29, 2014 3,500 58.7624 205,668.40 December 30, 2014 700 58.2699 40,788.93 January 02, 2015 25,202 58.7328 1,480,184.03 Total 29,402 58.7253 1,726,641.36
* Average price rounded (without incidental acquisition fees) ** (Number of stocks * Average price) Date Number of stocks Average price (EUR)* Total stock price (EUR)** Details Total previous months 813,296 57.2849 46,589,548.31 Total 843,189 57.2867 48,303,534.67 Percent of company's share capital 1.22
-
Week December 01 - December 05, 2014
-
January 2015
-
Week January 05 - January 09, 2015
* Average price rounded (without incidental acquisition fees) ** (Number of stocks * Average price) Date Number of stocks Average price (EUR)* Total stock price (EUR)** Details January 05, 2015 28,494 57.7518 1,645,579.79 January 06, 2015 28,215 57.1083 1,611,310.68 January 07, 2015 21,200 57.3693 1,216,229.16 January 08, 2015 17,562 57.8394 1,015,775.54 January 09, 2015 21,716 58.9778 1,280,761.90 Total 117,187 57.7680 6,769,657.07
-
Week January 12 - January 16, 2015
* Average price rounded (without incidental acquisition fees) ** (Number of stocks * Average price) Date Number of stocks Average price (EUR)* Total stock price (EUR)** Details January 12, 2015 23,465 59.1948 1,389,005.98 January 13, 2015 7,828 59.8234 468,297.58 January 14, 2015 24,958 59.6920 1,489,792.94 January 15, 2015 15,559 60.2974 938,167.25 January 16, 2015 13,000 61.5555 800,221.50 Total 84,810 59.9633 5,085,485.25
-
Week January 19 - January 23, 2015
* Average price rounded (without incidental acquisition fees) ** (Number of stocks * Average price) Date Number of stocks Average price (EUR)* Total stock price (EUR)** Details January 19, 2015 15.981 62.2355 994,585.53 January 20, 2015 23,200 62.8898 1,459,043.36 January 21, 2015 16.894 62.8742 1,062,196.73 January 22, 2015 13,000 63.6025 826,832.5 January 23, 2015 20.714 65.0243 1,346,913.35 Total 89.789 63.3660 5,689,571.47
-
Week January 26 - January 30, 2015
* Average price rounded (without incidental acquisition fees) ** (Number of stocks * Average price) Date Number of stocks Average price (EUR)* Total stock price (EUR)** Details January 26, 2015 13,700 65.3455 895,233.35 January 27, 2015 4,600 65.0850 299,391.00 January 28, 2015 4,950 63.9185 316,396.58 January 29, 2015 4,950 62.1472 307,628.64 January 30, 2015 4,950 62.2509 308,141.96 Total 33,150 64.1566 2,126,791.53
* Average price rounded (without incidental acquisition fees) ** (Number of stocks * Average price) Date Number of stocks Average price (EUR)* Total stock price (EUR)** Details Total previous months 843,189 57.2867 48,303,534.67 Total 1,193,327 58.2030 69,455,224.02 Percent of company's share 1.72
-
Week January 05 - January 09, 2015
-
February 2015
-
Week February 02 - February 06, 2015
* Average price rounded (without incidental acquisition fees) ** (Number of stocks * Average price) Date Number of stocks Average price (EUR)* Total stock price (EUR)** Details February 02, 2015 4,950 61.8124 305,971.38 February 03, 2015 4,400 62.9667 277,053.48 February 04, 2015 4.000 63.0038 252,015.20 February 05, 2015 2,061 63.9314 131,762.62 February 06, 2015 4,950 63.9241 316,424.30 Total 20,361 63.0238 1,283,226.98
-
Week February 09 - February 13, 2015
* Average price rounded (without incidental acquisition fees) ** (Number of stocks * Average price) Date Number of stocks Average price (EUR)* Total stock price (EUR)** Details February 09, 2015 4,370 63.2783 276,526.17 February 10, 2015 3,900 64.0616 249,840.24 February 11, 2015 4,950 64.4169 318,863.66 February 12, 2015 3,400 65.5513 222,874.42 February 13, 2015 4,800 67.1294 322,221.12 Total 21,420 64.9078 1,390,325.61
-
Week February 16 - February 20, 2015
* Average price rounded (without incidental acquisition fees) ** (Number of stocks * Average price) Date Number of stocks Average price (EUR)* Total stock price (EUR)** Details February 16, 2015 4,200 67.3386 282,822.12 February 17, 2015 4,950 67.3375 333,320.63 February 18, 2015 4,365 68.0912 297,218.09 February 19, 2015 4,200 68.8636 289,227.12 February 20, 2015 4,650 68.9763 320,739.80 Total 22,365 68.1121 1,523,327.76
-
Week February 23 - February 27, 2015
* Average price rounded (without incidental acquisition fees) ** (Number of stocks * Average price) Date Number of stocks Average price (EUR)* Total stock price (EUR)** Details February 23, 2015 4,950 68.2899 338,035.01 February 24, 2015 4,150 67.7724 281,255.46 February 25, 2015 4,325 68.2723 295,277.70 February 26, 2015 2,700 71.8263 193,931.01 February 27, 2015 4,990 70.6000 352,294.00 Total 21,115 69.1827 1,460,793.18
* Average price rounded (without incidental acquisition fees) ** (Number of stocks * Average price) Date Number of stocks Average price (EUR)* Total stock price (EUR)** Details Total previous months 1,193,327 58.2030 69,455,224.02 Total 1,278,588 58.7468 75,112,897.55 Percent of company's share 1.84
-
Week February 02 - February 06, 2015
-
March 2015
-
Week March 02 - March 06, 2015
* Average price rounded (without incidental acquisition fees) ** (Number of stocks * Average price) Date Number of stocks Average price (EUR)* Total stock price (EUR)** Details March 02, 2015 4,575 70.6444 323,198.13 March 03, 2015 4,990 71.0589 354,583.91 March 04, 2015 4,990 70.6193 352,390.31 March 05, 2015 4,390 71.3244 313,114.12 March 06, 2015 4,990 71.0259 354,419.24 Total 23,935 70.9298 1,697,705.71
-
Week March 09 - March 13, 2015
* Average price rounded (without incidental acquisition fees) ** (Number of stocks * Average price) Date Number of stocks Average price (EUR)* Total stock price (EUR)** Details March 09, 2015 4.500 71.0804 319,861.80 March 10, 2015 4,990 70.9381 353,981.12 March 11, 2015 2,933 71.1831 208,780.03 March 12, 2015 4,990 71.1230 354,903.77 March 13, 2015 1,000 70.9700 70,970.00 Total 18,413 71.0637 1,308,496.72
-
Week March 16 - March 20, 2015
* Average price rounded (without incidental acquisition fees) ** (Number of stocks * Average price) Date Number of stocks Average price (EUR)* Total stock price (EUR)** Details March 16, 2015 3,700 71.7350 265,419.50 March 17, 2015 4,990 70.7991 353,287.51 March 18, 2015 3,100 69.7235 216,142.85 March 19, 2015 4,990 70.1258 349,927.74 March 20, 2015 2,400 69.9746 167,939.04 Total 19,180 70.5275 1,352,716.64
-
Week March 23 - March 27, 2015
* Average price rounded (without incidental acquisition fees) ** (Number of stocks * Average price) Date Number of stocks Average price (EUR)* Total stock price (EUR)** Details March 23, 2015 3,850 70.1664 270,140.64 March 24, 2015 4,300 70.3091 302,329.13 March 25, 2015 4,990 70.8162 353,372.84 March 26, 2015 4,990 69.8264 348,433.74 March 27, 2015 4,950 70.7160 350,044.20 Total 23,080 70.3778 1,624,320.55
-
Week March 30 - March 31, 2015
* Average price rounded (without incidental acquisition fees) ** (Number of stocks * Average price) Date Number of stocks Average price (EUR)* Total stock price (EUR)** Details March 30, 2015 4,600 71.4746 328,783.16 March 31, 2015 4,990 71.0664 354,621.34 Total 9,590 71.2622 683,404.50
* Average price rounded (without incidental acquisition fees) ** (Number of stocks * Average price) Date Number of stocks Average price (EUR)* Total stock price (EUR)** Details Total previous months 1,278,588 58.7468 75,112,897.55 Total 1,372,786 59.5720 81,779,541.67 Percent of company's share 1.98
-
Week March 02 - March 06, 2015
-
April 2015
-
Week April 01 - April 02, 2015
* Average price rounded (without incidental acquisition fees) ** (Number of stocks * Average price) Date Number of stocks Average price (EUR)* Total stock price (EUR)** Details April 01, 2015 3,000 70.5966 211,789.80 April 02, 2015 3,700 71.5968 264,908.16 Total 6,700 71.1489 476,697.96
-
Week April 07 - April 10, 2015
* Average price rounded (without incidental acquisition fees) ** (Number of stocks * Average price) Date Number of stocks Average price (EUR)* Total stock price (EUR)** Details April 07, 2015 4,990 72.1834 360,195.17 April 08, 2015 4,990 72.7975 363,259.53 April 09, 2015 4,092 73.7416 301,750.63 April 10, 2015 4,990 73.9944 369,232.06 Total 19,062 73.1527 1,394,437.39
-
Week April 13 - April 17, 2015
* Average price rounded (without incidental acquisition fees) ** (Number of stocks * Average price) Date Number of stocks Average price (EUR)* Total stock price (EUR)** Details April 13, 2015 3,850 73.1988 281,815.38 April 14, 2015 4,990 73.2999 365,766.50 April 15, 2015 750 73.8240 55,368.00 April 16, 2015 4,950 73.6902 364,766.49 April 17, 2015 4,950 71.1222 352,054.89 Total 19,490 72.8461 1,419,771.26
-
Week April 20 - April 24, 2015
* Average price rounded (without incidental acquisition fees) ** (Number of stocks * Average price) Date Number of stocks Average price (EUR)* Total stock price (EUR)** Details April 20, 2015 1,400 71.3157 99,841.98 April 21, 2015 4,600 71.8604 330,557.84 April 22, 2015 4,990 71.2090 355,332.91 April 23, 2015 4,950 70.2084 347,531.58 April 24, 2015 2,400 69.9253 167,820.72 Total 18,340 70.9425 1,301,085.03
-
Week April 27 - April 30, 2015
* Average price rounded (without incidental acquisition fees) ** (Number of stocks * Average price) Date Number of stocks Average price (EUR)* Total stock price (EUR)** Details April 27, 2015 3,500 70.8102 247,835.70 April 28, 2015 4,990 70.6052 352,319.95 April 29, 2015 4,950 69.8173 345,595.64 April 30, 2015 3,750 68.8795 258,298.13 Total 17,190 70.0436 1,204,049.42
* Average price rounded (without incidental acquisition fees) ** (Number of stocks * Average price) Date Number of stocks Average price (EUR)* Total stock price (EUR)** Details Total previous months 1,372,786 59.5720 81,779,541.67 Total 1,453,568 60.2487 87,575,582.73 Percent of company's share 2.07
-
Week April 01 - April 02, 2015
-
May 2015
-
Week May 04 - May 08, 2015
* Average price rounded (without incidental acquisition fees) ** (Number of stocks * Average price) Date Number of stocks Average price (EUR)* Total stock price (EUR)** Details May 04, 2015 Share buy-back suspended May 05, 2015 Share buy-back suspended May 06, 2015 Share buy-back suspended May 07, 2015 2,300 65.4878 150,621.94 May 08, 2015 2,300 67.0752 154,272.96 Total 4,600 66.2815 304,894.90
-
Week May 11 - May 15, 2015
* Average price rounded (without incidental acquisition fees) ** (Number of stocks * Average price) Date Number of stocks Average price (EUR)* Total stock price (EUR)** Details May 11, 2015 4,000 67.6802 270,720.80 May 12, 2015 4,400 66.8595 294,181.80 May 13, 2015 4,650 66.9895 311,501.18 May 14, 2015 3,495 67.4223 235,640.94 May 15, 2015 4,347 67.9648 295,442.99 Total 20,892 67.3697 1,407,487.71
-
Week May 18 - May 22, 2015
* Average price rounded (without incidental acquisition fees) ** (Number of stocks * Average price) Date Number of stocks Average price (EUR)* Total stock price (EUR)** Details May 18, 2015 4,800 67.5901 324,432.48 May 19, 2015 4,990 68.5896 342,262.10 May 20, 2015 4,990 68.2607 340,620.89 May 21, 2015 1,900 68.5857 130,312.83 May 22, 2015 4,650 69.3346 322,405.89 Total 21,330 68.4498 1,460,034.19
-
Week May 26 - May 29, 2015
* Average price rounded (without incidental acquisition fees) ** (Number of stocks * Average price) Date Number of stocks Average price (EUR)* Total stock price (EUR)** Details May 26, 2015 4,500 69.4378 312,470.10 May 27, 2015 4,990 71.3809 356,190.69 May 28, 2015 4,990 70.5846 352,217.15 May 29, 2015 4,900 69.8360 342,196.40 Total 19,380 70.3341 1,363,074.34
* Average price rounded (without incidental acquisition fees) ** (Number of stocks * Average price) Date Number of stocks Average price (EUR)* Total stock price (EUR)** Details Total previous months 1,453,568 60.2487 87,575,582.73 Total 1,519,770 60.6086 92,111,073.87 Percent of company's share 2.19
-
Week May 04 - May 08, 2015
-
June 2015
-
Week June 01 - June 05, 2015
* Average price rounded (without incidental acquisition fees) ** (Number of stocks * Average price) Date Number of stocks Average price (EUR)* Total stock price (EUR)** Details June 1, 2015 4,990 69.1531 345,073.97 June 2, 2015 3,400 68.8053 233,938.02 June 3, 2015 4,000 68.9594 275,837.60 June 4, 2015 4,990 67.9814 339,227.19 June 5, 2015 4,490 67.3219 302,275.33 Total 21,870 68.4203 1,496,352.11
-
Week June 08 - June 12, 2015
* Average price rounded (without incidental acquisition fees) ** (Number of stocks * Average price) Date Number of stocks Average price (EUR)* Total stock price (EUR)** Details June 8, 2015 4,990 67.0585 334,621.92 June 9, 2015 2,300 66.3900 152,697.00 June 10, 2015 600 67.3700 40,422.00 June 11, 2015 4,990 68.4242 341,436.76 June 12, 2015 4,550 67.3367 306,381.99 Total 17,430 67.4446 1,175,559.67
-
Week June 15 - June 19, 2015
* Average price rounded (without incidental acquisition fees) ** (Number of stocks * Average price) Date Number of stocks Average price (EUR)* Total stock price (EUR)** Details June 15, 2015 4,990 66.3028 330,850.97 June 16, 2015 1,500 65.9254 98,888.10 June 17, 2015 4,990 66.9496 334,078.50 June 18, 2015 2,000 66.7425 133,485.00 June 19, 2015 4.990 68.5824 342,226.18 Total 18,470 67.1104 1,239,528.75
-
Week June 22 - June 26, 2015
* Average price rounded (without incidental acquisition fees) ** (Number of stocks * Average price) Date Number of stocks Average price (EUR)* Total stock price (EUR)** Details June 22, 2015 2,500 69.6695 174,173.75 June 23, 2015 4,990 71.9437 358,999.06 June 24, 2015 4,990 71.3758 356,165.24 June 25, 2015 4,590 71.3063 327,295.92 June 26, 2015 2,200 71.0027 156,205.94 Total 19,270 71.2423 1,372,839.91
-
Week June 29 - June 30, 2015
* Average price rounded (without incidental acquisition fees) ** (Number of stocks * Average price) Date Number of stocks Average price (EUR)* Total stock price (EUR)** Details June 29, 2015 4,990 69.1515 345,065.99 June 30, 2015 4,267 69.3588 295,954.00 Total 9,257 69.2471 641,019.99
* Average price rounded (without incidental acquisition fees) ** (Number of stocks * Average price) Date Number of stocks Average price (EUR)* Total stock price (EUR)** Details Total previous months 1,519,770 60.6086 92,111,073.87 Total 1,606,067 61.0413 98,036,374.30 Percent of company's share 2.32
-
Week June 01 - June 05, 2015
-
July 2015
-
Week July 01 - July 03, 2015
* Average price rounded (without incidental acquisition fees) ** (Number of stocks * Average price) Date Number of stocks Average price (EUR)* Total stock price (EUR)** Details July 1, 2015 24,147 70.3546 1,698,852.53 July 2, 2015 25,218 70.3935 1,775,183.28 July 3, 2015 20,415 70.2496 1,434,145.58 Total 69,780 70.3379 4,908,181.39
-
Week July 06 - July 10, 2015
* Average price rounded (without incidental acquisition fees) ** (Number of stocks * Average price) Date Number of stocks Average price (EUR)* Total stock price (EUR)** Details July 6, 2015 23,878 69.5626 1,661,015.76 July 7, 2015 24,026 69.1412 1,661,186.47 July 8, 2015 23,900 68.1160 1,627,972.40 July 9, 2015 5,800 69.1842 401,268.36 July 10, 2015 24,073 71.4023 1,718,867.57 Total 101,677 69.5370 7,070,310.56
-
Week July 13 - July 17, 2015
* Average price rounded (without incidental acquisition fees) ** (Number of stocks * Average price) Date Number of stocks Average price (EUR)* Total stock price (EUR)** Details July 13, 2015 24,197 73.2992 1,773,620.74 July 14, 2015 23,554 73.6435 1,734,599.00 July 15, 2015 19,008 74.3032 1,412,355.23 July 16, 2015 22,000 76.4085 1,680,987.00 July 17, 2015 23,750 75.9841 1,804,622.38 Total 112,509 74.7157 8,406,184.35
-
Week July 20 - July 24, 2015
* Average price rounded (without incidental acquisition fees) ** (Number of stocks * Average price) Date Number of stocks Average price (EUR)* Total stock price (EUR)** Details July 20, 2015 18,300 76.5084 1,400,103.72 July 21, 2015 23,500 76.7431 1,803,462.85 July 22, 2015 20,545 77.0210 1,582,396.45 July 23, 2015 24,086 77.5480 1,867,821.13 July 24, 2015 24,634 76.6969 1,889,351.43 Total 111,065 76.9201 8,543,135.58
-
Week July 27 - July 31, 2015
* Average price rounded (without incidental acquisition fees) ** (Number of stocks * Average price) Date Number of stocks Average price (EUR)* Total stock price (EUR)** Details July 27, 2015 24,720 75.8079 1,873,971.29 July 28, 2015 14,982 76.1368 1,140,681.54 July 29, 2015 19,250 76.8177 1,478,740.73 July 30, 2015 23,829 76.7359 1,828,539.76 July 31, 2015 23,976 78.5740 1,883,890.22 Total 106,757 76.8645 8,205,823.54
* Average price rounded (without incidental acquisition fees) ** (Number of stocks * Average price) Date Number of stocks Average price (EUR)* Total stock price (EUR)** Details Total previous months 1,606,067 61.0413 98,036,374.30 Total 2,107,855 64.1268 135,170,009.72 Percent of company's share 3.04
-
Week July 01 - July 03, 2015
-
August 2015
-
Week August 03 - August 07, 2015
* Average price rounded (without incidental acquisition fees) ** (Number of stocks * Average price) Date Number of stocks Average price (EUR)* Total stock price (EUR)** Details August 3, 2015 25,709 78.8542 2,027,262.63 August 4, 2015 21,830 78.5384 1,714,493.27 August 5, 2015 9,991 79.4735 794,019.74 August 6, 2015 14,592 79.9218 1,166,218.91 August 7, 2015 22,888 79.3282 1,815,663.84 Total 95,010 79.1249 7,517,658.39
-
Week August 10 - August 14, 2015
* Average price rounded (without incidental acquisition fees) ** (Number of stocks * Average price) Date Number of stocks Average price (EUR)* Total stock price (EUR)** Details August 10, 2015 20,040 79.9132 1,601,460.53 August 11, 2015 24,055 80.2602 1,930,659.11 August 12, 2015 25,888 77.8332 2,014,945.88 August 13, 2015 24,609 78.8971 1,941,578.73 August 14, 2015 25,550 79.0195 2,018,948.23 Total 120,142 79.1363 9,507,592.48
-
Week August 17 - August 21, 2015
* Average price rounded (without incidental acquisition fees) ** (Number of stocks * Average price) Date Number of stocks Average price (EUR)* Total stock price (EUR)** Details August 17, 2015 26,484 76.9584 2,038,166.27 August 18, 2015 20,511 78.2029 1,604,019.68 August 19, 2015 27,091 77.0973 2,088,642.95 August 20, 2015 27,418 76.2815 2,091,486.17 August 21, 2015 27,442 74.3392 2,040,016.33 Total 128,946 76.4842 9,862,331.40
-
Week August 24 - August 28, 2015
* Average price rounded (without incidental acquisition fees) ** (Number of stocks * Average price) Date Number of stocks Average price (EUR)* Total stock price (EUR)** Details August 24, 2015 28,381 70.7591 2,008,214.02 August 25, 2015 30,190 72.2690 2,181,801.11 August 26, 2015 31,200 72.0240 2,247,148.80 August 27, 2015 22,572 74.4367 1,680,185.19 August 28, 2015 29,129 74.7911 2,178,589.95 Total 141,472 72.7772 10,295,939.07
-
Week August 31, 2015
* Average price rounded (without incidental acquisition fees) ** (Number of stocks * Average price) Date Number of stocks Average price (EUR)* Total stock price (EUR)** Details August 31, 2015 18,297 74.6351 1,365,598.42 Total 18,297 74.6351 1,365,598.42
* Average price rounded (without incidental acquisition fees) ** (Number of stocks * Average price) Date Number of stocks Average price (EUR)* Total stock price (EUR)** Details Total previous months 2,107,855 64.1268 135,170,009.72 Total 2,611,722 66.5152 173,719,129.48 Percent of company's share 3.77
-
Week August 03 - August 07, 2015
-
September 2015
-
Week September 01 - September 04, 2015
* Average price rounded (without incidental acquisition fees) ** (Number of stocks * Average price) Date Number of stocks Average price (EUR)* Total stock price (EUR)** Details September 1, 2015 29,375 72.8087 2,138,755.56 September 2, 2015 30,716 73.1485 2,246,829.33 September 3, 2015 27,500 74.6147 2,051,904.25 September 4, 2015 32,907 73.8107 2,428,888.70 Total 120,498 73.5811 8,866,377.84
-
Week September 07 - September 11, 2015
* Average price rounded (without incidental acquisition fees) ** (Number of stocks * Average price) Date Number of stocks Average price (EUR)* Total stock price (EUR)** Details September 7, 2015 24,766 73.8368 1,828,642.19 September 8, 2015 32,427 75.6290 2,452,421.58 September 9, 2015 31,639 78.6725 2,489,119.23 September 10, 2015 28,105 78.5667 2,208,117.10 September 11, 2015 29,772 77.6594 2,312,075.66 Total 146,709 76.9576 11,290,375.76
-
Week September 14 - September 18, 2015
* Average price rounded (without incidental acquisition fees) ** (Number of stocks * Average price) Date Number of stocks Average price (EUR)* Total stock price (EUR)** Details September 14, 2015 33,737 77.5053 2,614,796.31 September 15, 2015 28,919 76.5055 2,212,462.55 September 16, 2015 30,669 76.7845 2,354,903.83 September 17, 2015 34,064 76.4210 2,603,204.94 September 18, 2015 34,357 75.5768 2,596,592.12 Total 161,746 76.5519 12,381,959.75
-
Week September 21 - September 25, 2015
* Average price rounded (without incidental acquisition fees) ** (Number of stocks * Average price) Date Number of stocks Average price (EUR)* Total stock price (EUR)** Details September 21, 2015 34,278 75.5362 2,589,229.86 September 22, 2015 32,782 74.2475 2,433,981.55 September 23, 2015 24,100 74.1925 1,788,039.25 September 24, 2015 32,940 74.1087 2,441,140.58 September 25, 2015 26,892 76.1460 2,047,718.23 Total 150,992 74.8391 11,300,109.47
-
Week September 28 - September 30, 2015
* Average price rounded (without incidental acquisition fees) ** (Number of stocks * Average price) Date Number of stocks Average price (EUR)* Total stock price (EUR)** Details September 28, 2015 33,792 75.3296 2,545,537.84 September 29, 2015 33,729 74.5395 2,514,142.80 September 30, 2015 33,583 74.5937 2,505,080.23 Total 101,104 74.8216 7,564,760.87
* Average price rounded (without incidental acquisition fees) ** (Number of stocks * Average price) Date Number of stocks Average price (EUR)* Total stock price (EUR)** Details Total previous months 2,611,722 66.5152 173,719,129.48 Total 3,292,771 68.3688 225,122,713.17 Percent of company's share 4.75
-
Week September 01 - September 04, 2015
-
October 2015
-
Week October 01 - October 02, 2015
* Average price rounded (without incidental acquisition fees) ** (Number of stocks * Average price) Date Number of stocks Average price (EUR)* Total stock price (EUR)** Details October 1, 2015 33,999 76.0972 2,587,228.70 October 2, 2015 34,449 75.1888 2,590,178.97 Total 68,448 75.6400 5,177,407.67
-
Week October 05 - October 09, 2015
* Average price rounded (without incidental acquisition fees) ** (Number of stocks * Average price) Date Number of stocks Average price (EUR)* Total stock price (EUR)** Details October 5, 2015 21,201 76.9630 1,631,692.56 October 6, 2015 35,145 78.6047 2,762,562.18 October 7, 2015 35,453 80.3719 2,849,424.97 October 8, 2015 26,661 80.3260 2,141,571.49 October 9, 2015 34,155 81.7316 2,791,542.80 Total 152,615 79.7877 12,176,794.00
-
Week October 12 - October 16, 2015
* Average price rounded (without incidental acquisition fees) ** (Number of stocks * Average price) Date Number of stocks Average price (EUR)* Total stock price (EUR)** Details October 12, 2015 35,175 81.9199 2,881,532.48 October 13, 2015 35,773 77.1405 2,759,547.11 October 14, 2015 32,500 76.2545 2,478,271.25 October 15, 2015 34,500 77.8078 2,684,369.10 October 16, 2015 20,000 78.9475 1,578,950.00 Total 157,948 78.3971 12,382,669.94
-
Week October 19 - October 23, 2015
* Average price rounded (without incidental acquisition fees) ** (Number of stocks * Average price) Date Number of stocks Average price (EUR)* Total stock price (EUR)** Details October 19, 2015 20,000 78.6610 1,573,220.00 October 20, 2015 19,857 79.4031 1,576,707.36 October 21, 2015 14,050 80.5040 1,131,081.20 October 22, 2015 18,158 80.6350 1,464,170.33 October 23, 2015 13,270 82.5748 1,095,767.60 Total 85,335 80.1658 6,840,946.49
-
Week October 26 - October 30, 2015
* Average price rounded (without incidental acquisition fees) ** (Number of stocks * Average price) Date Number of stocks Average price (EUR)* Total stock price (EUR)** Details October 26, 2015 22,000 83.4091 1,835,000.20 October 27, 2015 19,200 82.2812 1,579,799.04 October 28, 2015 14,500 82.7585 1,199,998.25 October 29, 2015 14,057 83.2350 1,170,034.40 October 30, 2015 13,841 83.9842 1,162,425.31 Total 83,598 83.1032 6,947,257.20
* Average price rounded (without incidental acquisition fees) ** (Number of stocks * Average price) Date Number of stocks Average price (EUR)* Total stock price (EUR)** Total stock price (EUR)** Details Total previous months 3,292,771 68.3688 225,122,713.17 Total 3,840,715 69.9473 268,647,788.47 Percent of company's share 5.54
-
Week October 01 - October 02, 2015
-
November 2015
-
Week November 02 - November 06, 2015
* Average price rounded (without incidental acquisition fees) ** (Number of stocks * Average price) Date Number of stocks Average price (EUR)* Total stock price (EUR)** Details November 2, 2015 19,619 85.0006 1,667,626.77 November 3, 2015 18,600 84.3655 1,569,198.30 November 4, 2015 7,713 84.5800 652,365.54 November 5, 2015 7,900 84.3263 666,177.77 November 6, 2015 7,253 84.2886 611,345.22 Total 61,085 84.5824 5,166,713.60
-
Week November 09 - November 13, 2015
* Average price rounded (without incidental acquisition fees) ** (Number of stocks * Average price) Date Number of stocks Average price (EUR)* Total stock price (EUR)** Details November 9, 2015 7,400 84.2870 623,723.80 November 10, 2015 4,400 83.2361 366,238.84 November 11, 2015 7,950 84.3216 670,356.72 November 12, 2015 7,548 84.1165 634,911.34 November 13, 2015 6,575 83.9287 551,831.20 Total 33,873 84.0511 2,847,061.90
-
Week November 16 - November 20, 2015
* Average price rounded (without incidental acquisition fees) ** (Number of stocks * Average price) Date Number of stocks Average price (EUR)* Total stock price (EUR)** Details November 16, 2015 3,696 84.8170 313,483.63 November 17, 2015 5,446 86.1102 468,956.15 November 18, 2015 3,155 87.3432 275,567.80 November 19, 2015 5,779 88.3569 510,614.53 November 20, 2015 6,974 87.6888 611,541.69 Total 25,050 87.0325 2,180,163.80
-
Week November 23 - November 27, 2015
* Average price rounded (without incidental acquisition fees) ** (Number of stocks * Average price) Date Number of stocks Average price (EUR)* Total stock price (EUR)** Details November 23, 2015 6,268 87.3383 547,436.46 November 24, 2015 3,170 87.4202 277,122.03 November 25, 2015 5,885 88.5075 520,866.64 November 26, 2015 7,922 88.5831 701,755.32 November 27, 2015 4,600 88.9943 409,373.78 Total 27,845 88.2225 2,456,554.23
-
Week November 30, 2015
* Average price rounded (without incidental acquisition fees) ** (Number of stocks * Average price) Date Number of stocks Average price (EUR)* Total stock price (EUR)** Details November 30, 2015 6,306 89.2131 562,577.81 Total 6,306 89.2131 562,577.81
* Average price rounded (without incidental acquisition fees) ** (Number of stocks * Average price) Date Number of stocks Average price (EUR)* Total stock price (EUR)** Details Total previous months 3,840,715 69.9473 268,647,788.47 Total 3,994,874 70.5556 281,860,859.81 Percent of company's share 5,76
-
Week November 02 - November 06, 2015
-
December 2015
* Average price rounded (without incidental acquisition fees) ** (Number of stocks * Average price) Date Number of stocks Average price (EUR)* Total stock price (EUR)** Details Total previous months 3,994,874 70.5556 281,860,859.81 Total 4,134,094 71.0712 293,815,058.59 Percent of company's share 5.96
-
Monthly overview
* Average price rounded (without incidental acquisition fees) ** (Number of stocks * Average price) Month Number of stocks Average price (EUR)* Total stock price (EUR)** Percent of company's share capital October 2014 573,685 56.6819 32,517,560.14 0.83 November 2014 239,611 58.7285 14,071,988.17 0.35 December 2014 29,893 57.3374 1,713,986.36 0.04 January 2015 350,138 60.4096 21,151,689.35 0.51 February 2015 85,261 66.3571 5,657,673.53 0.12 March 2015 94,198 70.7727 6,666,644.12 0.14 April 2015 80,782 71.7492 5,796,041.06 0.12 May 2015 66,202 68.5099 4,535,491.14 0.10 June 2015 86,297 68.6617 5,925,300.43 0.12 July 2015 501,788 74.0026 37.133.635,42 0.72 August 2015 503,867 76.5065 38,549,119.76 0.73 September 2015 681,049 75.4771 51,403,583.69 0.98 October 2015 547,944 79.4334 43,525,075.30 0.79 November 2015 154,159 85.7107 13,213,071.34 0.22 December 2015 139,220 85.8655 11,954,198.78 0.20 Total 4,134,094 71.0712 293,815,058.59 5.96
Share Buyback HOCHTIEF Aktiengesellschaft 2013
The buyback was carried out in the period between June 17, 2013 and December 5, 2013.
-
June 2013
* Average price rounded (without incidental acquisition fees) ** (Number of stocks * Average price) Date Number of stocks Average price (EUR)* Total stock price (EUR)** Details June 17, 2013 31,948 51.8149 1,655,382.43 June 18, 2013 31,052 51.1614 1,588,663.79 June 19, 2013 34,284 50.9218 1,745,802.99 June 20, 2013 57,878 49.0956 2,841,555.14 June 21, 2013 61,047 48.1336 2,938,411.88 June 24, 2013 57,679 46.5661 2,685,886.08 June 25, 2013 34,819 47.2558 1.645.399,70 June 26, 2013 38,293 48.9652 1,875,024.40 June 27, 2013 45,000 49.6641 2.234.884,50 June 28, 2013 67,514 50.3137 3,396,879.14 Total 459,514 49.1996 22,607,890.05 Percent of company's share capital 0.60
-
July 2013
* Average price rounded (without incidental acquisition fees) ** (Number of stocks * Average price) Date Number of stocks Average price (EUR)* Total stock price (EUR)** Details Total previous month 459,514 49.1996 22,607,890.05 July 01, 2013 46,486 51.5823 2,397,854.80 July 02, 2013 62,049 52.0494 3,229,613.22 July 03, 2013 35,951 50.8300 1,827,389.33 July 04, 2013 24,620 51.7455 1,273,974.21 July 05, 2013 55,163 52.0058 2,868,795.95 July 08, 2013 33,768 53.0170 1,790,278.06 July 09, 2013 41,083 53.1345 2,182,924.66 July 10, 2013 26,000 52.9097 1,375,652.20 July 11, 2013 37,000 53.3547 1,974,123.90 July 12, 2013 37,950 53.5231 2,031,201.65 July 15, 2013 35,692 54.0148 1,927,896.24 July 16, 2013 26,000 53.5137 1,391,356.20 July 17, 2013 31,020 53.7890 1,668,534.78 July 18, 2013 40,000 54.6637 2,186,548.00 July 19, 2013 48,900 55.0266 2,690,800.74 July 22, 2013 23,804 54.1252 1,288,396.26 July 23, 2013 25,400 54.8544 1,394,505.72 July 24, 2013 13,000 55.4052 720,938.40 July 25, 2013 26,399 56.3173 1,486,720.40 July 26, 2013 40,688 56.6767 2,306,061.57 July 29, 2013 23,500 57.2044 1,344,303.40 July 30, 2013 28,200 57.9466 1,634,094.12 July 31, 2013 41,513 57.2494 2,376,594.34 Total since start of buyback 1,263,700 52.2075 65,974,573.44 Percent of company's share capital 1.64
-
August 2013
* Average price rounded (without incidental acquisition fees) ** (Number of stocks * Average price) Date Number of stocks Average price (EUR)* Total stock price (EUR)** Details Total previous months 1,263,700 52.2075 65,974,573.44 August 01, 2013 41,075 57.0485 2,343,267.14 August 02, 2013 30,043 56.7230 1,704,129.09 August 05, 2013 19,200 57.1937 1,098,119.04 August 06, 2013 35,824 56.9915 2,041,663.50 August 07, 2013 23,500 55.8163 1,311,683.05 August 08, 2013 35,658 56.9536 2,030,851.47 August 09, 2013 41,000 57.0893 2,340,661.30 August 12, 2013 28,000 57.3773 1,606,564.40 August 13, 2013 27,150 57.6251 1,564,521.47 August 14, 2013 38,902 57.0317 2,218,647.19 August 15, 2013 45,828 56.5484 2,591,500.08 August 16, 2013 23.500 56.6991 1,332,428.85 August 19, 2013 44,118 55.5940 2,452,696.09 August 20, 2013 34,054 53.7341 1,829,861.04 August 21, 2013 36,170 53.9594 1,951,711.50 August 22, 2013 24,500 54.7575 1,341,558.75 August 23, 2013 20,256 55.4410 1,123,012.90 August 26, 2013 16,607 55.5231 922,072.12 August 27, 2013 43,884 54.6960 2,400,279.26 August 28, 2013 37,031 53.6779 1,987,746.31 August 29, 2013 26,977 54.0659 1,458,535.78 August 30, 2013 42,305 53.9685 2,283,137.39 Total since start of buyback 1,979,282 53.5089 105,909,221.16 Percent of company's share capital 2.57
-
September 2013
* Average price rounded (without incidental acquisition fees) ** (Number of stocks * Average price) Date Number of stocks Average price (EUR)* Total stock price (EUR)** Details Total previous months 1,979,282 53.5089 105,909,221.16 September 02, 2013 34,413 55.2155 1,900,131.00 September 03, 2013 32,061 55.2136 1,770,203.23 September 04, 2013 21,704 55.6131 1,207,026.72 September 05, 2013 36,629 56.1391 2,056,319.09 September 06, 2013 37,667 55.9515 2,107,525.15 September 09, 2013 23,000 56.9267 1,309,314.10 September 10, 2013 34.900 59.0649 2,061,365.01 September 11, 2013 30,000 60.7563 1,822,689.00 September 12, 2013 2,221 61.6678 136,964.18 September 13, 2013 9,049 62.9402 569,545.87 September 16, 2013 43,944 63.5173 2,791,204.23 September 17, 2013 13,035 63.4346 826,870.01 September 18, 2013 41,800 62.4427 2,610,104.86 September 19, 2013 38,000 62.7360 2,383,968.00 September 20, 2013 23,637 62.6437 1,480,709.14 September 23, 2013 32,568 62.7279 2,042,922.25 September 24, 2013 21,267 63.7588 1,355,958.40 September 25, 2013 28,772 64.6720 1,860,742.78 September 26, 2013 32,000 64.6398 2,068,473.60 September 27, 2013 39,900 64.6756 2,580,556.44 September 30, 2013 20,672 64.2390 1,327,948.61 Total since start of buyback 2,576,521 55.1828 142,179,762.83 Percent of company's share capital 3.35
-
October 2013
* Average price rounded (without incidental acquisition fees) ** (Number of stocks * Average price) Date Number of stocks Average price (EUR)* Total stock price (EUR)** Details Total previous months 2,576,521 55.1828 142,179,762.83 October 01, 2013 43,632 65.3401 2,850,919.24 October 02, 2013 45,163 64.4008 2,908,533.33 October 03, 2013 40,000 60.9251 2,437,004.00 October 04, 2013 38,000 61.3550 2,331,490.00 October 07, 2013 21,000 61.3321 1,287,974.10 October 08, 2013 34,720 62.2088 2,159,889.54 October 09, 2013 49,295 61.6802 3,040,525.46 October 10, 2013 14,200 63.1742 897,073.64 October 11, 2013 30,000 63.9907 1,919,721.00 October 14, 2013 21,066 64.5198 1,359,174.11 October 15, 2013 55,065 65.1512 3,587,550.83 October 16, 2013 47.400 65.0730 3,084,460.20 October 17, 2013 56,309 63.7114 3,587,525.22 October 18, 2013 25,500 64.6136 1,647,646.80 October 21, 2013 44,060 65.5565 2,888,419.39 October 22, 2013 26,005 66.0057 1,716,478.23 October 23, 2013 27,000 65.2214 1,760,977.80 October 24, 2013 53,560 66.1264 3,541,729.98 October 25, 2013 24,000 65.3137 1,567,528.80 October 28, 2013 60,934 65.4475 3,987,977.97 October 29, 2013 14,177 65.9135 934,455.69 October 30, 2013 39,863 66.8772 2,665,925.82 October 31, 2013 39,800 66.5885 2,650,222.30 Total since start of buyback 3,427,270 57.4781 196,992,966.28 Percent of company's share capital 4.45
-
November 2013
* Average price rounded (without incidental acquisition fees) ** (Number of stocks * Average price) Date Number of stocks Average price (EUR)* Total stock price (EUR)** Details Total previous months 3,427,270 57.4781 196,992,966.28 November 01, 2013 18,135 66,8316 1.211.991,07 November 04, 2013 20,569 67.4076 1,386,506.92 November 05, 2013 45,200 67.2883 3,041,431.16 November 06, 2013 19,418 67.8151 1,316,833.61 November 07, 2013 44,500 68.1528 3,032,799.60 November 08, 2013 42,157 66.5118 2,803,937.95 November 11, 2013 15,916 66.8473 1,063,941.63 November 12, 2013 46,800 66.1078 3,093,845.04 November 13, 2013 34,469 68.2419 2,352,230.05 November 14, 2013 47,900 68.1612 3,264,921.48 November 15, 2013 26,910 67.9576 1,828,739.02 November 18, 2013 22,238 67.9084 1,510,147.00 November 19, 2013 37,530 67.3136 2,526,279.41 November 20, 2013 42,500 66.4723 2,825,072.75 November 21, 2013 43,600 66.3215 2,891,617.40 November 25, 2013 41,900 65.8348 2,758,478.12 November 26, 2013 42,000 65.8294 2,764,834.80 November 27, 2013 43,700 65.8082 2,875,818.34 November 28, 2013 11,139 64.7037 720,734.51 November 29, 2013 33,139 65.0230 2,154,797.20 Total since start of buyback 4,148,231 59.0964 245,145,557.71 Percent of company's share capital 5.39
-
December 2013
* Average price rounded (without incidental acquisition fees) ** (Number of stocks * Average price) Date Number of stocks Average price (EUR)* Total stock price (EUR)** Details Total previous months 4,148,231 59.0964 245,145,557.71 December 02, 2013 46,600 64.8562 3,022,298.92 December 03, 2013 40,600 63.3500 2,572,010.00 December 04, 2013 39,060 62.5187 2,441,980.42 December 05, 2013 38,509 61.5523 2,370,317.52 Total since start of buyback 4.313.000 59,2516 255.552.164,57 Percent of company's share capital 5,60
-
Monthly overview
* Average price rounded (without incidental acquisition fees) ** (Number of stocks * Average price) Month Number of stocks Average price (EUR)* Total stock price (EUR)** Percent of company's share capital June 2013 459,514 49.1996 22,607,890.05 0.60 July 2013 804,186 53.9262 43,366,683.39 1.04 August 2013 715,582 55.8072 39,934,647.72 0.93 September 2013 597,239 60.7304 36,270,541.67 0.78 October 2013 850,749 64.4293 54,813,203.37 1.10 November 2013 720,961 66.7894 48,152,591.43 0.94 December 2013 164,769 63.1587 10,406,606.86 0.21 Total 4,313,000 59.2516 255,552,164.57 5.60